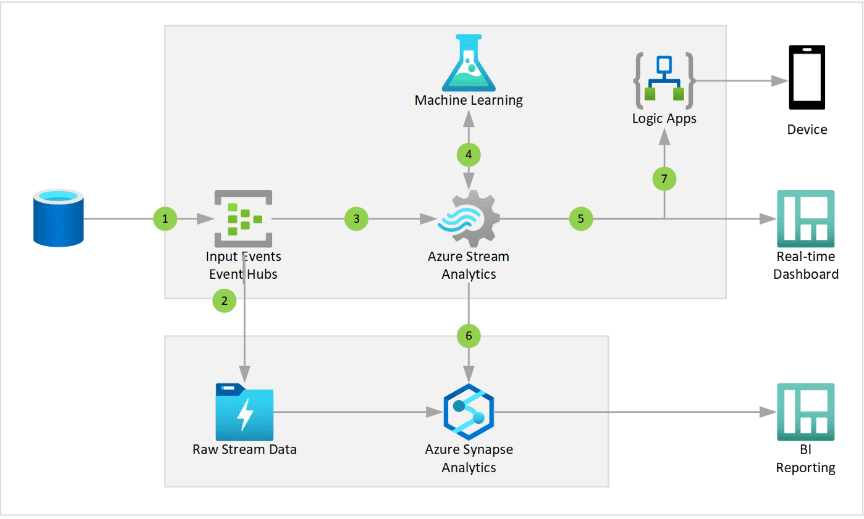
This article explains how to develop a real-time data integration using Azure resources and a python program. Using Azure event hub & Azure stream analytics, we are going to retrieve real-time stock details to the Power BI dashboard.
Sign in to the Azure portal and navigate to your resource group section. Then create a resource group under your subscription.

Search Azure Event Hub in the marketplace and create an event hub namespace.

Now create an event hub under the event hub namespace and also you can configure partition count as well.

To communicate event hubs with the python program, we have to create an access policy under the event hubs namespace. Go to Shared access policies in the left side panel.
Then create a shared access policy with the “Manage” option and save.

Search Azure Streaming Analytics in the marketplace and create. And remember to select the same geographical location as an Azure event hub namespace. Using stream analytics, you will be able to access data sent through the Azure event hub.

After Creating a streaming analytics job, we have to configure the input for the stream analytics job. Go to the input section under the job topology and set up the event hub configuration.

Using the Python program, we are going to retrieve stock information and send that information to azure using an azure event hub configured in our azure account.
Import the below libraries to develop a python program
from dis import findlinestarts
import pandas as pd
import json
from yahoo_fin import stock_info as si
from azure.eventhub.aio import EventHubProducerClient
from azure.eventhub import EventData
from azure.eventhub.exceptions import EventHubError
import asyncio
from datetime import datetime

import warnings
warnings.filterwarnings("ignore", category=FutureWarning)
warnings.filterwarnings("ignore", category=DeprecationWarning)
Python program to send stock information to an azure event hub
con_string = 'Event Hub Connection String'
eventhub_name = 'Event Hub Name'

def get_stock_data(stockName):
stock_pull = si.get_quote_data(stockName)

stock_df = pd.DataFrame([stock_pull],columns=stock_pull.keys())[['regularMarketTime','regularMarketPrice','marketCap','exchange','averageAnalystRating']]

stock_df['regularMarketTime'] = datetime.fromtimestamp(stock_df['regularMarketTime'])

stock_df['regularMarketTime'] =  stock_df['regularMarketTime'].astype(str)

stock_df[['AnalystRating','AnalystBuySell']] = stock_df['averageAnalystRating'].str.split(' - ',1,expand=True)

stock_df.drop('averageAnalystRating',axis=1,inplace=True)

stock_df['MarketCapInTrillion'] = stock_df.apply(lambda row: "$" + str(round(row['marketCap']/1000000000000,2)) + 'MM',axis=1)

return stock_df.to_dict('record')

datetime.now()

get_stock_data('AAPL')async def run():
# Create a producer client to send messages to the event hub.
# Specify a connection string to your event hubs namespace and# the event hub name.
while True:
await asyncio.sleep(5)
producer = EventHubProducerClient.from_connection_string(conn_str=con_string, eventhub_name=eventhub_name)
async with producer:
# Create a batch.
event_data_batch = await producer.create_batch()
# Add events to the batch.
event_data_batch.add(EventData(json.dumps(get_stock_data('AAPL'))))
# Send the batch of events to the event hub.
await producer.send_batch(event_data_batch)
print('Stock Data Sent To Azure Event Hub')
loop = asyncio.get_event_loop()
try:
loop.run_until_complete(run())
loop.run_forever()
except KeyboardInterrupt:
pass
finally:
print('Closing Loop Now')
loop.close()Once we completed the python program, we can see the python program sending data to an azure event hub. To verify that, go to Azure Stream Analytics Job> Query section.

In this section, we are going to develop a Power BI dashboard using real-time data coming through an azure event hub.
To Create a Power BI dashboard, navigate to the output option under “Job Topology” and add the Power BI option as below.

Then Configure the below information and authorize to create of a Power BI dataset in your workspace

Now go to Power BI workspace and you can see the dataset created using the stream analytics job.

To create a dashboard, Go to the new and select the dashboard option in the menu section, and type the name for your Power BI dashboard.

Now we can add visuals to the Power BI report and to that, go to the edit section and select the “Add Tile” option.

Select the “Custom Streaming Data” option and select the dataset we created using Azure Stream Analytics Job.

Now you can add multiple Cards, Line Charts, etc depending on your requirement. There are only a few visuals available for streaming analytics data but we will be able to create a meaningful dashboard using available components.
Authored by Janaka Nawarathna @ BISTEC Global